Leon Hunsaker with Claude Curran, "Final Report", April 10, 2013.
(c) 2013, Mike Barkley
[I have put my (c) on this until Mr. Hunsaker & Dr.Curran decide to add it to theirs.]
( See here for exact .pdf copy - this page is an
OCR scan of that page, with light html coding and .jpg exhibits inserted)
JANUARY 1862 SUPERFLOODS
In view of the recent levee and Folsom Dam upgrades, we are concerned
that the citizens of Sacramento and environs do not understand the
destructive potential of a repeat of the 1861 - 62 flood series. This
report presents compelling evidence that there were two superfloods in
January 1862 - - less than two weeks apart. We call them superfloods
because they were both larger than the recent major floods of February
1986 and January 1997. Our report also details why the official peak
flow estimate of 320,000 CFS for the January 10, 1862 superflood at
Folsom/Fair Oaks is ~ 40% too low.
Based upon the above information, and more, this report outlines a
"common sense scenario" describing Sacramento’s flood potential in
the event of a repeat of the currently underrated 1861 - 62 flood series.
INTRO-1
INTRODUCTION
A review of our report: Step by Step Estimate of The Peak Flow on The
American River @ Folsom for Record Flood: 1/10/1862, dated
June 10, 2011, shows only minor changes in our thinking between
then and now regarding the magnitude of our peak flow
estimate. However, there is a significant difference. Today’s estimate
is supported by a much stronger foundation. A good example is what
we call the "Snell Factor" contribution to the 3-day flow. Two years
ago our estimate of 10% was based mainly on supposition. A similar
estimate today is based upon a series of well-founded calculations
that include Dr. Snell’s 1861 - 62 Sonora rainfall measurements. Our
report vindicates Dr. Snell for his much maligned weather observation
of 30 inches of rain in Sonora during the 10 day period January 14, 1862
through January 23, 1862.
A second major item that makes the foundation of our estimate much
stronger, is some unpublished research by Robert Collins. For many
years he was the district hydrologist for the Sacramento District
of the Army Corps of Engineers. Following my presentation at the
June 2010 Extreme Precipitation Symposium held at the University of
California at Davis, Mr. Collins made this statement: "Assuming that
the precipitation amounts were about equal because of the extra
low-level snow melt, the heaviest 3-day January 1862 flow on the
American River at Folsom/Fair Oaks was ~ 30% larger than the 3-day
flow for either the February 1986 or January 1997 floods." The storm
and watershed research in our book "Lake Sacramento", along with the
findings in this report, strongly support this conclusion.
Other storm and watershed factors capable of increasing river flows,
previously overlooked, have been researched and are listed below:
1. The water holding capabilities of fresh snow and how this can
dramatically add to peak flows produced by heavy warm storms.
2. How the early January 1862 cold spell increased the runoff during
the heavy warm flood producing storm of January 9 - 11, 1862.
3. How the three heavy storms of late December 1861 made a runoff
contribution to the flood producing storm of January 9 - 11, 1862.
Note: In the conclusions of this report (page 17) we
briefly discuss how a rapid sequence of major flood events similar
to the 1861 - 62 series, would affect levee systems and flood control
operations.
INTRO-2
WHY THE EARLY JANUARY 1862 FLOOD WAS SIGNIFICANTLY
LARGER THAN EITHER THE FEBRUARY 1986 OR JANUARY 1997
FLOODS ON THE AMERICAN RIVER AT FOLSOM/FAIR OAKS
A. EXTRA LOW LEVEL SNOW MELT: Robert Collins retired district hydrologist
for the Sacramento District of the Army Corps of Engineers had this to
say following my presentation at the June 2010 Extreme Precipitation
Symposium held at the University of California at Davis. "Assuming that
the precipitation amounts were about equal, because of the extra low
level snow melt, the heaviest 3-day January 1862 flow on the American
River at Folsom/Fair Oaks was ~ 30% larger than the 3-day flow for either
the February 1986 or January 1997 floods." This conclusion is supported
by snow profiles 2, 8 and 9 in our book: "Lake Sacramento". Mr. Collin’s
statement may be heard on the following website: www.cepsym.Info
Then click on the following:
Proceedings
2010 conference
Scroll down to Hunsaker
(last name on the list)
Select audio - visual
B. EXPANDING SCALE OF NRC’s FIGURE 3.1: We need to choose the optimum
range of fresh snowpack depths that will make the greatest contribution
to the peak flow. To avoid any controversy, we are going to use the same
range of depths that existed on the ~ 51 mi.˛ South Yuba River watershed
above Cisco just prior to the late January 1963 flood producing storm.
This range of snow depths *(4 inches to 30 inches) was one of the main
factors responsible for the record-breaking peak flow of 18,400 CFS that
occurred at Cisco late the 31st of January 1963. Refer to
Exhibit A for details on how the water holding capabilities of
fresh snow can dramatically increase the magnitude of the peak flow by
delaying the runoff.
*Note: This estimate of the existing snowpack depth range was made
using measurements taken at the Big Bend Ranger station and Soda Springs
1E. Both of these measurement stations are located within the boundaries
of the ~ 51 mi.˛ South Ynba River watershed above Cisco.
A storm comparison of the percentage of Yuba watershed area covered with
a blanket of fresh snow 4 inches to 30 inches deep above Smartville,
tells the story. On January 7, 1862 ~ 42% of the Yuba watershed
1
was covered with a blanket of fresh snow 4 inches to 30 inches deep
`just prior to a record breaking flood. See snow profile-2 in
"Lake Sacramento". Just prior to the major flood producing storm
of January 1997 a similar range of snow depths covered less than 25% of
the Yuba watershed. See prolile-9 [profile?]. The only major
flood in the 20th century with a larger snowpack in the 4 inch to 30
inch depth range, prior to the onset of a flood producing storm,
was *December 1964 with an area coverage of ~ 37%. See profile -7.
*Note: Our research indicates the December 1964 flood peak of
171,700 CFS on the Yuba River at Englebright Dam was the highest peak
flow that would have occurred at this location since January 1862.
Since a large percentage of the Yuba watershed in early January 1862 was
covered with fresh snow in the 4 inch to 30 inch depth range, we made
the assumption that the late January 1963 snowpack on the South Yuba
River watershed above Cisco was proportionately similar to the snowpack
that blanketed the American River watershed in early January 1862. Then
we compared the peak flows for each flood on the South Yuba River at
Cisco - - 15,000 CFS for January 1997, 18,400 CFS for January 1963.
The January 1963 peak flow was 23% higher than the January 1997 peak flow.
Maury Roos Chief Hydrologist for the California Department of Water
Resources estimated a peak flow on the American River at Folsom/Fair
Oaks during the major flood of January 1997 of 295,000 CFS. If we
increase the Roos’ estimate at Folsom by 23% we get a preliminary
estimate of *365,000 CFS for the peak flow on January 10, 1862 at Folsom.
*Note: Rounded off to the nearest 5,000 CFS.
A similar peak flow estimate ( ~ 365,000 CFS) can be obtained by using
our modified version of figure 3.1 from the 1999 National Research
Council report: Improving American River Flood Frequency Analyses.
Step No.1: Take the 200,000 CFS estimate of the greatest 3-day
January 1862 flow at Folsom from the February 23, 1999 DWR report:
Analysis of 1862 Precipitation and Runoff. Locate its position along
the Y axis of our *modified figure 3.1.
Step No. 2: Then move in a horizontal direction toward the right
until you intersect the extended regression line.
2
Step No. 3: At this point drop vertically downward to the X axis.
This also gives an estimated January 1862 peak flow of 365,000 CFS at Folsom.
*Note: The NRC’s figure 3.1 was modified to include the DWR’s
estimated maximum 3-day January 1862 flow data. This modification was
made by Holger Sommer. Professor Sommer taught fluid mechanics at
Carnegie Melon University in Pittsburgh, Pennsylvania.
This modification expands the scale of figure 3.1 and allows us
to estimate peak flows beyond the limits of the original graph. By
increasing the January 1997 3-day flow at Folsom/Fair Oaks by 30%, as
stated by Robert Collins, gives an average 3-day flow for January 9,
10 and 11, 1862 of ~ 213,000 CFS. Then using our modified version
of figure 3.1 we obtain an estimated peak flow of ~ 414,000 CFS.
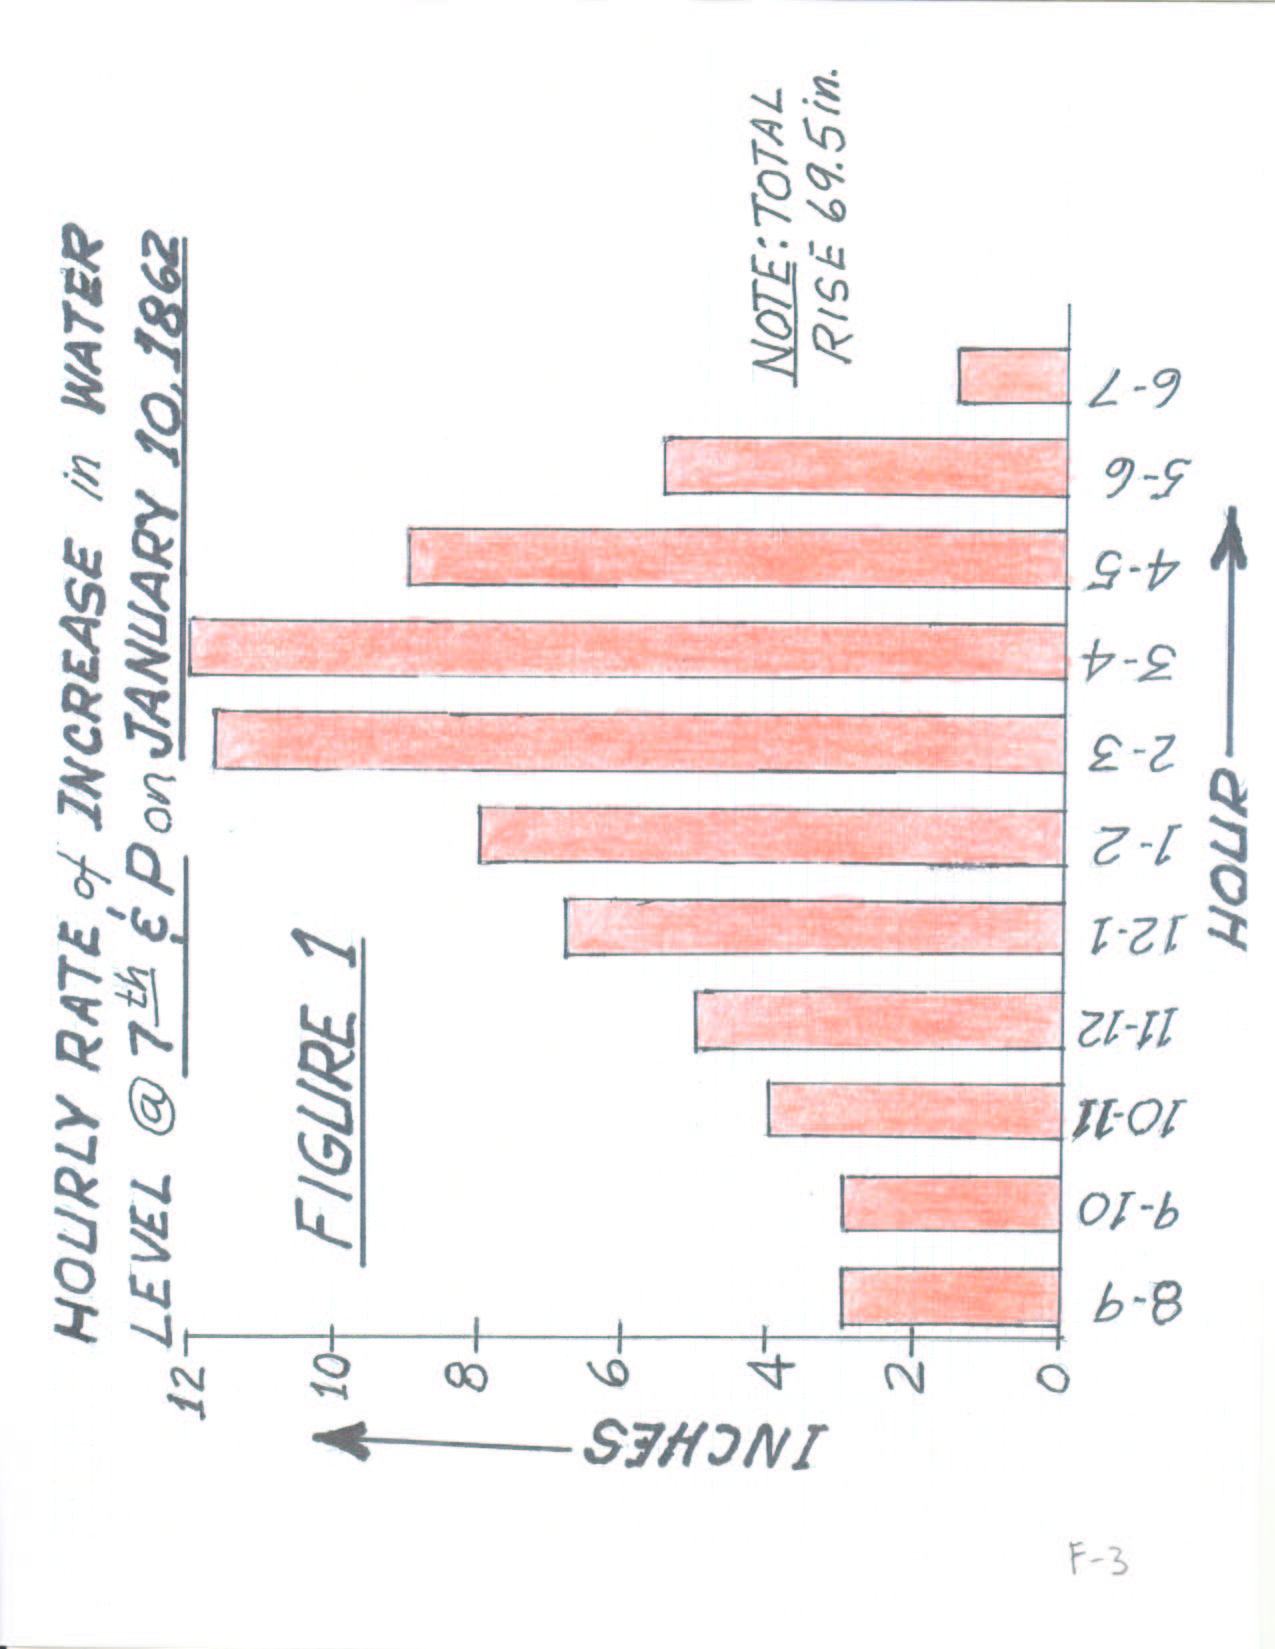
Do we have any information suggesting that runoff from the early
January 1862 flood producing storm was delayed by a fresh snowpack?
See figure 1. The hourly rate of increase in water level,
(carefully measured--words used in news report) at Seventh
and P streets in Sacramento between 7 AM and 9 PM on January 10th,
sheds light on this possibility. Take note of the rapid rate of
increase in hourly rates between 2 PM and 4 PM. We are confident that
this rapid increase in water level was not due to a nearby
levee break along the American River. A statement on page 15 of
California History (spring of 1979 edition) says: "On January 9, 1862,
the upstream levee at Rabel’s Tannery again gave way, despite
attempts to strengthen the line since the last break. The river levels
were even higher than they had been in December." (upstream added
for clarity) Nor do we subscribe to the idea that it was due primarily
to an extra heavy burst of rain. See item 2 in Exhibit F. In
Item 2 it states: At this writing (9 PM January 10, 1862 in
Placerville ~ 40 miles to the east) it (the rain) seems to be coming
down in torrents - - rivulets are turned into rivers which sweeps
everything before them. According to the information we have from
Seventh and P streets in Sacramento, the peak flow was reached at
about the same time - - around 9 PM on January 10, 1862. This indicates
tha
t if the peak flow had been driven primarily by the rainfall that
it would have occurred later the night of the 10th or morning of
January 11, 1862.
Given the snow conditions that existed in the mountains along with
continued heavy rain, we are prepared to say the sudden rise in water
level, as shown in figure 1, is a result of a widespread collapse
of the snowpack
3
(across a substantial area of the watershed) over a period of just a few
hours. This scenario is described very well in a Special Weather Summary
in the Weather Bureau publication "Climatological Data, Oregon, December
1964".
Conclusion: As indicated above, the runoff delay caused by
the fresh snowpack would have significantly increased the peak flow on
the American River at Folsom. This fact lends support to our 414,000 CFS
peak flow estimate based upon Robert Collin’s January 1862 3-day flow
estimate of 30% larger than either January 1997 or February 1986.
C. DR. PEREZ SNELL’S 1861-62 RAINFALL MEASUREMENTS FOR SONORA STRONGLY
SUGGEST THE JANUARY 1862 PRECIPITATION ON THE AMERICAN RIVER WATERSHED HAS
BEEN UNDERESTIMATED
Because of the unusual magnitude of Snell’s measurements, their accuracy
has been called into question. However, our extensive in-depth review
has caused us to think otherwise. Exhibit B is a data sheet
that lists Dr. Snell’s Sonora precipitation measurements along with
January 1862 daily observations from Sacramento and Grass Valley. It
also includes daily amounts for January 10 and 11, 1862 measured at
*Red Dog by W. A. Bigoli.
*Note: Red Dog is ~ 7 miles ESE of Nevada City. Elevation: 2800
feet.
In order to make maximum use of Dr. Snell’s Sonora data we divided the
January precipitation measurements into two 10 day periods. The first
10-days covers the period January 2 through January 11, 1862.
The second 10-days covers the period January 14 through January 23,
1862--the same time frame in which Dr. Snell reported 30 inches of
rain in Sonora. These two 10-day periods account for over 95% of
the precipitation that fell during the month of January 1862 at both
Grass Valley and Sacramento. Another item of interest: There are two
major storms in each 10-day period. In each case the precipitation
that fell during the final three days was from heavy warm storm activity.
My estimate of the location of the jetstream (storm track), during both
heavy warm storms, has it coming out of Southern California and extending
4
in a northerly direction generally parallel to the Sierra. However,
the storm track across Southern California during the warm phase of
the second 10-day period was farther south and east and impinged upon
the San Gabriel Mountains. See figure 2. This development
produced a peak flow on the Santa Ana River over three times larger
than the peak of 100,000 CFS that occurred during the devastating
flood of 1938 in the same area.
D. EVIDENCE OF SIMILARITIES BETWEEN THE TWO SUPER FLOOD PRODUCING
STORMS OF JANUARY 1862
According to rainfall data, from the Sacramento -- Grass Valley region,
the precipitation was uniformly widespread and the amounts were
proportional. If we divide the 10-day precipitation for the second
storm period into the 10-day amount for the first storm period, at
both Sacramento and Grass Valley, the results are surprisingly
uniform - - 79.6% in Sacramento, 79.9% in Grass Valley. Assuming
these same conditions prevailed as far south as Sonora, suggests that
reasonably accurate estimates can be made for the missing data at
Sonora. For example: We have no measurement of how much
precipitation fell in Sonora during the first 10-day period
(January 2 through January 11, 1862). Using Sacramento precipitation
as a guide if we multiply Dr. Snell’s precipitation amount for the
second 10-day period (30 inches by 79.6%) we get an estimate of 23.9
inches at Sonora for the first 10-day storm period of January 1862.
A comparison of the magnitudes of the two 3-day flood producing storms
of January 1862 at Sonora will require several additional estimates.
The 3-day total rainfall for Sacramento (January 9, 10 and 11, 1862)
was 3.16 inches compared with 3.15 inches during the 3-day period
(January 20, 21 and 22, 1862). Now if we divide 3.16 inches by the
first 10-day Sacramento storm total of 6.55 inches we get 48%.
Following the same procedure with the second 10-day storm period,
gives an answer of 38%. In summary these percentages represent that
portion of the total 10-day precipitation produced by warm storm
activity. If we multiply the total estimated precipitation for the
first 10-day period (23.9 inches by 48%), we get an estimated 3-day
warm storm total at Sonora of 11.47 inches. Using data from
the second 10-day period (30 inches multiplied by 38%) gives a similar
three-day estimate at Sonora of 11.4 inches. This is another
example of the proportional distribution of the precipitation that
existed throughout the region.
5
All of these comparisons are suggesting that the impact of the two
storms on the region was similar. Do we have any runoff data that
supports this conclusion?
In Sacramento we have the following information:
1. The flood of January 1862 reached its highest point at Seventh and
P about 9 PM on the 10th--a rise of 69.5 inches since 7 AM. Source:
The floods of 1861-62 at and near Sacramento, compiled from daily
newspapers by City Engineer's Grunsky and Given.
2. On page 15 of California History (The magazine of the California
Historical Society), for the spring of 1979: "By the morning of
January 10th, the southern part of Sacramento was under two and a
half feet of water."
3. January 22, 1862: Water in the city is 5 inches above December 9,
1861 and 15 inches below January 10th. Source: same as in item
number one above. Location: believed to be the same as in item one.
Summary: Based upon the above information, we can draw the following
conclusions:
1. At 9 PM on January 10, 1862, the depth of the water at Seventh
and P in Sacramento was ~ 100 inches.
2. During the flood of January 22, 1862, the maximum depth of the
water at Seventh and P was ~ 85 inches.
At Nelson’s Point ( ~ 10 miles south of Quincy) on the middle
fork of the Feather River, a gold miner named Plug sent the following
information to the editor of the Plumas Standard:
1. A letter from Plug dated January 15, 1862 stated: "About Saturday
noon January 11, 1862 the water reached its highest mark, which was
some 28 feet above its ordinary level."
2. A second letter from Plug (10 days later) stated: "We are just now
recovering from another deluge--our third great flood. The river reached
the height of 26 feet above ordinary low water mark."
Discussion and Conclusions: A two foot difference in peak flows
appears to be reasonable. This can be explained, at least in part, by
the more
6
favorable watershed runoff conditions that existed prior to the
heavy warm storm of January 9, 10 and 11, 1862. The same line of reasoning
can be used to at least partially explain the difference in the water
levels at Seventh and P streets in Sacramento. Another argument to
consider is presented in the following section - - section E.
E. EVIDENCE OF DIFFERENCES BETWEEN THE TWO SUPER FLOOD PRODUCING STORMS
OF JANUARY 1862
Looking in a northerly direction, there is a bend in the Sierra toward
the east as it crosses the American River watershed and is the reason
much of the Western section has a southerly aspect. This becomes
discernible on a relief map when the elevation of Placerville
(at 1,890 feet) is compared with other higher elevation precipitation
measurement stations farther north, such as Iowa Hill (at 2,930 feet),
also located near the same longitude. This combination of geographical
features provides a *channel for the strong southerly winds which
accompany heavy warm storms. See Exhibit C. It also
appears to make it possible to use (what we call) orographic lift
factors to make reasonable estimates of rainfall amounts at higher
elevations (such as Blue Canyon) when using data from a low-level upwind
station like Placerville.
*Note: The existence of channeling is indisputable! A
comparison of the 3-day rainfall totals at Deer Creek powerhouse
(elevation 3,700 feet--located just below Blue Canyon along the same
longitude line as Iowa Hill) and Blue Canyon shows they are similar.
This is true even though the elevation at Blue Canyon ranged from
1,000 feet higher than Deer Creek before 1945 on up to 1,600 feet higher
after 1945. Without the channeling effect, the 3-day totals at Blue
Canyon (5,280 feet elevation) would have undoubtedly been larger
than Deer Creek. For more information on channeling in this
region, see Exhibit D.
In both January 1862 warm storm cases the channeling of the southerly
upsiope winds, along this segment of the Sierra, appears to be similar.
But there is a subtle difference. As we mentioned earlier, the
southerly jetstream that was in play during the second warm storm was
located farther south and east. See figure 2. We know this is
true in Southern California because of the record-breaking peak flow
of 317,000 CFS that occurred on the Santa Ana River January 22, 1862.
Toward the
7
North, a comparison of the 3-day Grass Valley rainfall amounts for both
January warm storms indicate the winds aloft over the Grass Valley-Nevada
City area were more southeasterly during the second storm. The 12.2
inches that fell in Grass Valley on January 9-11 compares favorably
with the estimated 11.47 inches recorded in Sonora during the same
period of time. The Grass Valley amount is larger due in part to its
higher elevation. On the other hand, a comparison of the 3-day total
that fell at Grass Valley (*8.92 inches) and the estimated 11.4 inches
that fell in Sonora during the second warm storm defies similar logic
because the comparison is reversed.
We have concluded this disparity was caused by a rain shadow that
developed over the Grass Valley-Nevada City area during the second
warm storm. A close examination of our large relief map backs this
conclusion. Just east of Grass Valley and Nevada City, there is a bend
in the Sierra ridgeline toward the northwest. It is our opinion that
this bend caused the wind which was already blowing from the southeast
to become even more southeasterly with a down slope component.
Comparatively speaking this caused a sharp decrease in Grass Valley
rainfall. See Exhibit C.
*Note: A review of the available precipitation reports at the
beginning and ending of the 3-day period, suggests the actual 72 hour
rainfall in Grass Valley during the second warm storm was closer to
8.5 inches.
TRANSITION: There was likely minor rain shadow interference in
the Grass Valley-Nevada City area during the first superflood producing
storm. However, it wasn’t enough to drop the 3-day storm total for Grass
Valley below that of Sonora. This places the January 9 - 11, 1862 storm
in the same general category as the major storms of the 20th century
because in all cases the 3-day and 10-day precipitation amounts were
larger in Grass Valley than Sonora. This indicates that the atmospheric
dynamics for the early January 1862 storm and the major flood producing
storms of the 20th century were similar. As a result the two heaviest
storms of the 20th century -- February 1986 and January 1997 were
selected to be tested to see which one had the precipitation producing
dynamics that compared best with the precipitation producing dynamics
that prevailed during the January 9-11, 1862 storm.
F. DETERMINING WHICH 20TH CENTURY STORM COMPARED BEST WITH THE
JANUARY 9-11, 1862 SUPER STORM
8
Before we run a test, we need to establish a standard of comparison.
The DWR in their February 23, 1999 report made two 3-day 1862 rainfall
estimates for Blue Canyon. One was for 20 inches the other
21 inches and will be the standard used to select which of the
two heaviest 20th century storms comes closest to matching the
January 9 - 11, 1862 storm. These estimated 3-day rainfall totals
for Blue Canyon were the cornerstones of two different methods
used by the DWR to estimate the maximum 3-day January 1862 flow on
the American River at Folsom/Fair Oaks. Since no 1862 rainfall data
are available for Blue Canyon, a 3-day rainfall (warm storm) relationship
was developed between the Grass Valley - Nevada City area and Blue
Canyon using 20th century data. See figure 3.
Our goal is to estimate the Blue Canyon rainfall for the January 9 - 11,
1862 storm using January 1862 rainfall data from the Grass Valley - Nevada
City area as the starting point. We chose Red Dog. It is located ~ 7
miles ESE of Nevada City (elevation 2800 ft.) and is within ~ 8 air
miles of Iowa Hill - - another key station used in our analysis.
Fortunately a resident of Red Dog by the name of W. A. Bigoli, measured
the rainfall for the two heaviest days - - the 10th and 11th. The total
for the two days in Red Dog was 11.32 inches compared with 9.43 inches
in Grass Valley. Since the observation times of these two measurements
were only three hours apart, using ratio and proportion along with the
2.77 inches of rain that fell in Grass Valley on January 9th, should give
a fairly accurate answer. Our estimate of the precipitation that fell at
Red Dog on the 9th is 3.33 inches--making the estimated 3-day total
for Red Dog 14.65 inches.
Since our test involves estimating the 3-day January 9-11, 1862 storm
total for Blue Canyon, we need to calculate (what we call) the 3-day
orographic lift factors between Iowa Hill and Blue Canyon for both
the February 1986 and January 1997 flood producing storms. After making
adjustments for differences in elevation, combining these results with
the 14.65 inch estimated storm total for Red Dog will give a final 3-day
estimate at Blue Canyon for both 20th century storms.
ORIGINAL THREE-DAY OROGRAPHIC LIFT FACTORS
FOR FEBRUARY 1986 AND JANUARY 1997
9
February 1986        Station       January 1997

   18.64 in.       Blue Canyon       16.10 in.
                     5,280 ft.
   12.64 in.         Iowa Hill       12.89 in.
                     2,930 ft
    9.04 in.         Placerville      8.28 in.
                     1,890 ft.
Note: A more accurate adjustment for the difference in
elevation between Red Dog and Blue Canyon, is obtained when the
difference in 3-day rainfall amounts between Iowa Hill and Blue
Canyon is expressed in thousandths of an inch per 100 feet.
February 1986: Difference in 3-day rainfall totals (Iowa Hill - Blue
Canyon): 6 in. divided by 23.5 = .255 in./100 ft.
January 1997: (Following the same procedure) = .136 in./100 ft.
Difference in elevation between Red Dog and Iowa Hill - - 130 ft..
Orographic lift factor for February 1986: 1.3 x .255 = .33 in.
Orographic lift factor for January 1997: 1.3 x .136 = .18 in.
Blue Canyon 3-day estimate using the original February 1986 lift factors
14.65 in. Red Dog 3-day total
 6.00 in. lift factor (Iowa Hill - Blue Canyon)
  .33 in. elevation adjustment (Red Dog - Iowa Hill)
20.98 in.
Blue Canyon 3-day estimate using the original January 1997 lift factors
14.65 in. Red Dog 3-day total
 3.21 in. lift factor (Iowa Hill -Blue Canyon)
  .18 in. elevation adjustment (Red Dog - Iowa Hill)
18.04 in.
As you can see the 3-day 20.98 inch estimate, using the orograhic [sic] lift
factor from the February 1986 storm, compares very well with the DWR’s
3-day estimates of 20 and 21 inches.
G. ADJUSTING BLUE CANYON OBSERVATION TIME TO MATCH IOWA HILL AND PLACERVILLE
10
At this juncture we made a decision to adjust the Blue Canyon 24-hour
precipitation observation time from midnight to 8 AM. This was done
to make our analysis more compatible with the 24-hour precipitation
amounts measured at Placerville and Iowa Hill. Both of these stations
have 8 AM observation times. This was relatively easy to accomplish
since Blue Canyon measures the precipitation in hourly increments.
However the observation time adjustment increased the heaviest 3-day
rainfall total at Blue Canyon for the February 1986 storm from
18.64 inches to 19.69 inches. As a result a new lift
factor calculation was made between Iowa Hill and Blue Canyon along
with a new 130 foot elevation adjustment estimate between Red Dog and
Iowa Hill. The Red Dog to Iowa Hill adjustment increased from .33
of an inch to .39 of an inch while the original orographic lift
factor between Iowa Hill and Blue Canyon increased from 6
inches to 7.05 inches. This gives an adjusted 3-day estimate
for Blue Canyon, following the Red Dog - Iowa Hill - Blue Canyon route,
of 22.09 inches. See Exhibit E for more details on
the final Red Dog -Iowa Hill - Blue Canyon calculations.
H. ESTIMATING BLUE CANYON RAINFALL ALONG A SONORA - PLACERVILLE
- IOWA HILL - BLUE CANYON ROUTE.
In view of these promising results we decided to estimate the 3-day
rainfall total for Blue Canyon following along a Sonora - Placerville
- Iowa Hill - Blue Canyon route. We took our 11.47 inch
(January 9 - 11, 1862) storm estimate for Sonora and projected it
northward toward Placerville near the southwestern boundary of the
American River watershed. First, we should point out that the elevations
of Sonora and Placerville are similar, ~ 1,800 feet for Sonora compared
with 1,890 feet at Placerville. In addition, there doesn’t appear to be
any serious terrain impediments to southerly airflow between the two
points. This suggests that the 3-day rainfall amounts, at Sonora and
Placerville were essentially equal (11.47 inches) - -at least for
the first warm storm (January 9, 10 and 11, 1862). This may not have
been true for the second warm storm because of an increasing chance
of a rain shadow as you move northward from the vicinity of
Placerville toward the Grass Valley - Nevada City area. The 3-day rainfall
of 12.2 inches in Grass Valley supports our Sonora estimate of 11.47 inches.
11
Are you ready for this? The estimated 3-day rainfall at Blue
Canyon is 22.12 inches for the January 9 - 11, 1862 storm when
following the Sonora - Placerville - Iowa Hill -Blue Canyon route.
See Exhibit C. This is essentially the same estimate
(22.09 inches) obtained from the Red Dog - Iowa Hill - Blue Canyon
route. See Exhibit E for proof of this assertion.
See Exhibit F for reports that discount the role that rain
shadows may have played during the January 9-11, 1862 storm along the
western and southern sections of the American River watershed.
Note: At this point it is time to stop and review
what has been accomplished. There are no January 1862 rainfall
measurements available for Blue Canyon. The method generally used
to solve this problem involves developing a 3-day heavy warm storm
relationship between the Grass Valley-Nevada City area and Blue
Canyon using 20th Century data. See figure 3. Then using the
DWR’s January 1862 3-day estimate of 14.7 inches for Nevada
City gives a 3-day estimate for Blue Canyon of ~ 21 inches.
To successfully develop this type of a relationship requires a larger
storm sample than just one case. However using (what we call)
orographic lift factors, we have managed to successfully develop
and test another method of estimating the 3-day January 9-11, 1862
rainfall total for Blue Canyon. It allows us to make use of Dr. Snell’s
1861-62 Sonora rainfall measurements. The details of this method
are outlined in Exhibit E.
I. USING THREE-DAY LIFT FACTOR INCREASES FOR FEBRUARY 1986 STORM
TO ESTIMATE THREE-DAY RAINFALL TOTALS AT BLUE CANYON FOR THE
JANUARY 9 - 11, 1862 STORM
February 1986	  Station	Elevation
  25.05 in.	Blue Canyon	 5,280 ft.
(56% increase)
  16.06 in.	 Iowa Hill	 2,930 ft.
(40% increase)
  11.47 in.	 Placerville	 1,890 ft.
Conclusion: The difference in the Blue Canyon rainfall totals,
that correspond with the adjusted February 1986 lift factor and
the lift factor increases as indicated by the heavier three-day
rainfall in 1862, is 25.05 in. - *22.12 in. = 2.93 in. This
difference represents a rainfall
12
increase of 13.3% at Blue Canyon when compared with the adjusted
February 1986 storm total.
*Note: This estimate comes from Route "B": Sonora - Placerville -
Iowa Hill -Blue Canyon and is based upon Dr. Snell’s January 1862 rainfall
measurements in Sonora.
J. OTHER FAVORABLE WATERSHED CONDITIONS THAT CONTRIBUTED TO THE RUNOFF
PRODUCED BY THE HEAVY WARM STORM OF JANUARY 9,10 AND 11,1862
In late December 1861 three significant storms hit the Northern and
Central Sierra. The first two storms had a snow line of ~ 4,600 feet
on the Yuba watershed and produced heavy amounts of snow above 5,500
feet. The third storm in the series was warmer with rain at times as
high as 6,000 feet. As a result, the lower lip of the snowpack (a product
of the two previous colder type storms) was the recipient of
approximately 4 to 5 inches of rain. Our rough calculations indicate
that the precipitation from this warmer storm along with the
accompanying snow melt would have saturated or nearly saturated the
snowpack up to a depth of ~ 8 inches by New Year’s Day. The elevation
at which the snowpack was ~ 8 inches deep was ~ 5,300 feet. At the same
time, we also estimate a 200 foot rise in elevation of the snowpack
lip--up to 4,800 feet.
The weather turned unusually cold in early January 1862 and by the
morning of the 4th, we estimate the minimum temperature at 5,000 feet
was close to 0°F. Temperatures this low would turn the nearly saturated
500 foot wide blanket of snow into a sheet of ice or icy snow. In
addition we estimate a minimum temperature of 8°F at an elevation of
4,200-4,300 feet. A reading this low suggests that the watershed soil
was frozen to a depth of several inches.
During the afternoon and evening of January 5th, a heavy snowstorm dumped
up to a foot of snow as low as the foothills with lighter amounts near
the valley floor. Higher up the snowfall amounts were greater, ~ 3 feet
fell between 4,000 and 5,000 feet. This heavy snow episode was followed
by heavy warm flood producing rains on January 9, 10, and 11, 1862.
13
After an examination of the above sequence of weather events along
with our estimate of the watershed conditions just prior to the warm
flood producing storm, we have reached the following conclusions:
1. The ~ 4,800 foot elevation mark, was the lower edge of a 500 foot
elevational band of ice and icy snow.
2. Below 4,800 feet we estimate several inches of frozen watershed
soil, as low as 3,300 feet. Early on freezing rain was also likely!
3. Because of the sheet of ice and icy snow along with a layer of
frozen soil several inches thick as low as 3,300 feet, runoff from
~ 20 to 25% of the watershed above Smartville, during the heavy warm
storm of January 9-11, 1862 was significantly greater than it otherwise
would have been.
4. In addition the snowpack was deep enough above 5,500 feet that most
of the 4-5 inches of rain that fell as high as 6,000 feet, during the
last storm of December 1861, remained in the snowpack--thus increasing
the density. Because of this when the heavy rains of January 9-11 hit,
the threshold density of the snowpack was reached earlier and drainage
from the snowpack below 6,000 feet started sooner which increased the
runoff. As a result another ~ 8% of the watershed area contributed extra
water to the flood.
Additional Comments:
1. Since the above Yuba watershed assessment was made near the northern
boundary of the American River watershed, we believe our findings are
reasonably representative of the December 1861 - January 1862 conditions
that existed on the American River watershed.
2. Because of limited data, admittedly the above estimates of the
watershed conditions are rough approximations. However, we believe they
give an adequate description of the conditions that existed just prior
to the onset and during the early stages of the heavy warm flood
producing storm of January 9 - 11, 1862.
K. FINAL PEAK FLOW ESTIMATE ON AMERICAN RIVER @ FOLSOM/FAIR OAKS ON
JANUARY 10, 1862
14
1. Principal Items Used To Make Final Peak Flow Estimate
a. Collins Estimate: January 9 - 11, 1862 flow 30% larger
than the 3-day maximum flows of either the February 1986 or January 1997
floods. See page 1 of the Main report.
b. Our Estimate (using Dr. Snell’s 1862 Sonora precipitation
data): The 3-day precipitation at Blue Canyon for the storm
(January 9 - 11, 1862) has been underestimated ~ 13.3 %.
See section I of the Main report.
Note: Before any runoff calculations can be made, we need to
convert the 13.3% underestimate of the January 9 - 11 Blue Canyon
precipitation to an acceptable runoff percentage. As a result we
selected the same precipitation/runoff ratio of 1.7 used by the DWR in
their calculations of the runoff produced by the January 9 - 11, 1862
storm. The 3-day January 1862 precipitation estimates for Blue Canyon
were the cornerstone of the methods used by the DWR to estimate
the 3-day 1862 runoff at Folsom/Fair Oaks. Therefore we are assuming it
(the heaviest 3-day Blue Canyon precipitation) was considered to be an
index representative of the entire American River watershed.
Calculations: If our interpretation of a 1.7
precipitation/runoff ratio is correct it means that for every 1.7 inches
of rain that falls there will be 1 inch of runoff. Stating it another
way: It also means that ~ 60% of the rain that falls will result in runoff.
Following this definition, the underestimate of 13.3% in the precipitation
that fell at Blue Canyon on January 9 - 11, 1862 amounts to ~ 8% more
runoff.
Combining the Collins Estimate with Our Estimate and
calculating the peak flow on the American River at Folsom/Fair
Oaks January 10, 1862.
Step No. 1: Take the official maximum 3-day flow for the
February 1986 flood on the American River @ Folsom/Fair Oaks
(166,000 CFS) and multiply it by 38%. Result: 63,080 CFS
Step No. 2: Add (63,080 CFS) to the 3-day February 1986
(166,000 CFS) flow for a total of 229,080 CFS. This is the
estimated maximum 3-day flow on the American River at Folsom/Fair
Oaks produced by the storm of January 9-11, 1862.
Step No. 3: Now referring to our modified version of NRC’s
figure 3.1 we obtain an estimated peak flow of ~ 468,000 CFS.
15
2. Secondary Items Considered In Making Peak Flow Estimate
a. The water holding capabilities of fresh snow and how this can
dramatically add to peak flows produced by heavy warm storms.
b. How the early January 1862 cold spell increased the runoff during
the heavy warm flood producing storm of January 9 - 11, 1862.
c. How the three heavy storms of late December 1861 made a runoff
contribution to the flood producing storm of January
9 - 11, 1862.
Note: All three of the above secondary items were researched
as outlined in Section J of this report and in our opinion did
make a meaningful contribution to the runoff produced by the superstorm
of January 9 - 11, 1862. There are two questions that need to be addressed:
1) Did the use of the DWR’s 1.7 precipitation/runoff ratio include these
items? 2) if not, how much did they add to the 3-day flow?
Discussion: A statement in the DWR’s February 23, 1999 report:
Analysis of 1862 Precipitation and Runoff says an estimated runoff
volume for 1862 was made using the 1997 precipitation/runoff ratio of
1.7. Then it goes on to say this was done because the 1862 event had
wet antecedent conditions like the 1997 event. However, an investigation
shows that none of the special 1862 watershed factors (listed above) were
equaled or exceeded during the 1996 - 97 flood. This indicates that the
antecedent watershed contribution to the runoff during the early
January 1862 flood exceeded the antecedent watershed contribution to the
January 1997 flood.
Conclusion: In answer to the second question: How much
did the secondary items listed above contribute to the three day flow?
Of course the answer is simple: we do not have the kind of data needed
to make such a determination. However, in view of the research contained
in section J of this report, we feel comfortable in adding
1 1/2% to the final three day runoff of 229,080 CFS.
Step No. 1: Multiply 229,080 CFS by 1 1/2% = 3,436 CFS.
Step No. 2: Add 229,080 and 3,436 CFS = 232,516 CFS
Step No. 3: Referring to our modified version of NRC’s figure 3.1
we obtain a final estimated peak flow of ~ 475,000 CFS.
16
L. FINAL OBSERVATIONS AND CONCLUSIONS
After over eight years, punctuated with intense periods of research and
study, it is hard for us to imagine how Sacramento will escape the
onslaught of a storm and flood series similar to that of
December 1861 - January 1862.
To be more specific about Sacramento: Assuming a sequence of storm
and flood activity as occurred in 1861 - 62, the current levee upgrades
and the admirably bold flood control plan that calls for lowering the
storage levels in Folsom Lake to ~ 400,000 acre feet ahead of the flood
has a reasonable chance of saving Sacramento from the first superflood.
The high volume flows that began when the first major flood hit, ~ 30 days
before the first superflood, will continue until the second superflood
takes over ~ 10 to 12 days later. This extended period of high flows
will weaken the levees and only add to the flood control problems a
second superflood will bring. With the superfloods occurring less than
two weeks apart, we expect this will be the final straw and breaks will
develop in the Sacramento levee system.
Several years ago we made a preliminary analysis of a few of the 50
heaviest consecutive days of runoff on the American River at Fair Oaks.
Specifically we compared the 50 heaviest consecutive days of runoff
during the December 1996 - January 1997 flood event with our rough
estimate of what the 50 heaviest consecutive days of runoff would have
been during the 1861-62 series. Our estimate of the runoff in 1861-62
was ~ 45% greater. Conclusion: Extended high flows will increase
stress on the levees. Lake Sacramento's Diagram B is proof of
high flows.
A Few Additional Comments Regarding The First Superflood:
If the flood control plan is properly executed, Sacramento will likely
be saved. But it is hard to visualize the Delta remaining dry with
what Professor Jeffery Mount described as ~ 1100 miles of fragile
levees. The record or near record flows that will be occurring on
rivers draining into the Sacramento and San Joaquin Valleys will
overwhelm the Delta levees.
Leon Hunsaker, MS (MIT)
with
Claude Curran, Ph D (U of Oklahoma)
April 10, 2013
17
EXHIBIT "A"
This exhibit explains how the water holding capabilities of fresh snow
can dramatically increase the magnitude of the peak flow in nearby
streams and rivers. Walter U. Garstka [sic, sometimes Gartska] and several
other scientists
from the Bureau of Reclamation conducted a laboratory experiment in
Denver, Colorado on December 20, 1951 to determine what happens when
water is sprinkled on a fresh snowpack. It wasn’t until years later
that Frederick A. Bertle, a hydraulic engineer for the Bureau of
Reclamation, presented the results to the Western Snow Conference
held in Colorado Springs April 1965.
Mr. Bertle’s introductory remarks were as follows: "Adequate design
of the spillway for a major storage reservoir requires the estimation
of a synthetic maximum probable flood hydrograph. This maximum probable
flood must represent a realistically critical combination of the major
causative hydrological factors. In many areas of the Western United
States, the maximum floods occur as a result of an extreme rain falling
on a relatively fresh snow cover. The snowpack will absorb the rainfall
from the early part of the storm and release it later. As a result of
the release of stored water from the snowpack, in addition to the melting
of snow and rainfall itself, the runoff peak flow may be considerably
more severe than would occur from the rainfall alone."
Note: The data contained in Mr. Bertle's paper were expanded
and published in June 1966 as a water resources technical publication
- - Engineering Monograph No. 35-- Bureau of Reclamation.
At this same April 1965 Snow conference in Colorado Springs,
H. Riesbol (Chief Hydrologist, Bechtel Corporation), L. Hunsaker (Senior
Meteorologist, PG&E Co.) and D. Mahoney (Engineer Trainee, PG&E Co). [sic]
also presented a paper. The title: Role of Snowmelt and Snowpack Storage
in Production of Runoff on Feather River Basin During December 1955 Flood.
The results showed significant amounts of water stored in the snowpack
at the end of the storm. There was ~ 24% and 33% liquid water by weight
at the 6,000 and 7,000 foot levels respectively thus supporting
Mr. Bertle's conclusions. The prevailing wisdom at the time is stated
on page 183 of Hydrology For Engineers, by Lindsley, Kohier
and Paulhus in Mcgraw-Hill’s 1958 edition. It says: "Runoff from
snowmelt water retained in the snowpack is not effective. Limited data
indicate that snow can retain
A-1
from 2 to 5% liquid water by weight." A new concept is born! The water
holding capability of fresh snow has been proven to be substantial.
A-2
EXHIBIT "B"
Exhibit B is a data sheet that lists daily precipitation amounts for
January 1862 at Sacramento and Grass Valley. It also includes a couple
of daily measurements (January 10 and 11) made at Red Dog. In addition
there are several precipitation reports for Sonora given to newspapers
by Dr. Snell. The content of these documents and reports are listed
below:
A. SONORA
1. Sacramento Union, Tuesday, January 21, 1862:
TREMENDOUS RAINFALL - The Stockton Independent says that a rain gauge,
carefully kept and registered by Dr. Snell of Sonora, Tuolumne County,
shows that from the 11th of November 1861, to the 14th of January 1862,
72 inches of water fell at that place.
2. Nevada Democrat, Thursday, January 23, 1862: The amount (of rain)
that fell at Sonora, according to a gauge by Dr. Snell up to the 14th
instant was 72 inches.
3. Sacramento Union, February 7, 1862: Rain in Tuolumne. - Dr. Snell
of Sonora, a gentleman who has the reputation of making correct
meteorological observations, reports that from November 10, 1861 to
January 23, 1862, 102 inches of rain had fallen.
B. RED DOG
1. Source: Page 30 of the Hand-Book Almanac under section
titled - Notabilia of The Floods of 1861-62
2. Data: 24-hour rainfall ending at 9 AM January lOth - 5.82 inches.
             "      "       "     "         "    11th - 5.50    "
C. GRASS VALLEY
1. Source: Grass Valley National Newspaper, Volume 9, Number 78,
February 6, 1862, page 2. Observation time: Noon
2. Daily Precipitation for January 1862 (in inches)
   1      2      3      4      5      6      7      8      9     10
        .05    .23           .20   1.55    .13    .13   2.77   5.10

  11     12     13     14     15     16     17     18     19     20
4.33    .09          1.42    .03   1.28   2.30   3.75    .43   3.60

  21     22     23     24     25     26     27     28     29     30
 .70   3.30   1.32                         .20           .21    .90

  31
B-1
D. SACRAMENTO
1. Source: State Climatological Files: CA Rain
2. Daily Precipitation for January 1862 (in inches)
   1      2      3      4      5      6      7      8      9     10
               .02          2.08    .61           .68   1.40    .76

  11     12     13     14     15     16     17     18     19     20
1.00                  .68          3.15   1.25                 1.65

  21     22     23     24     25     26     27     28     29     30
 .80    .70                                              .25

  31
B-2
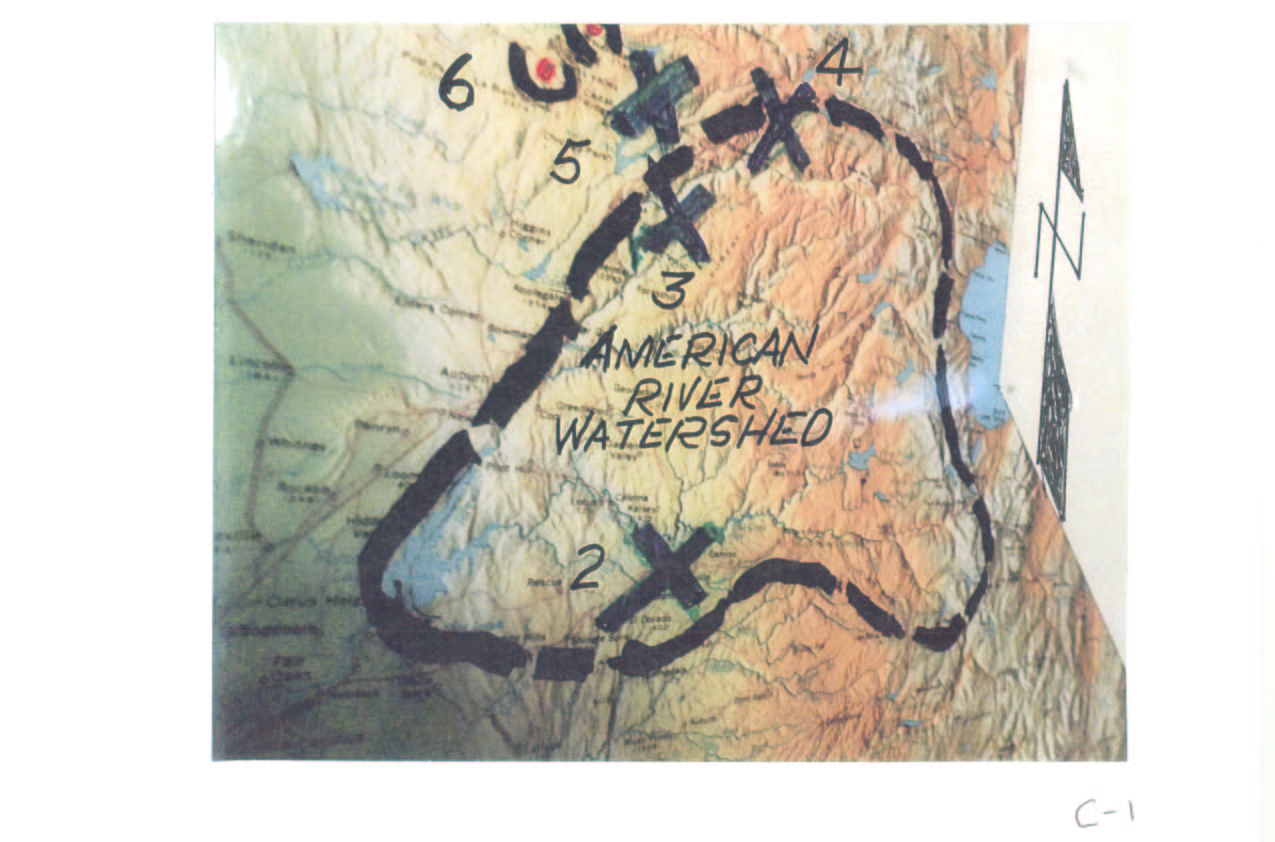
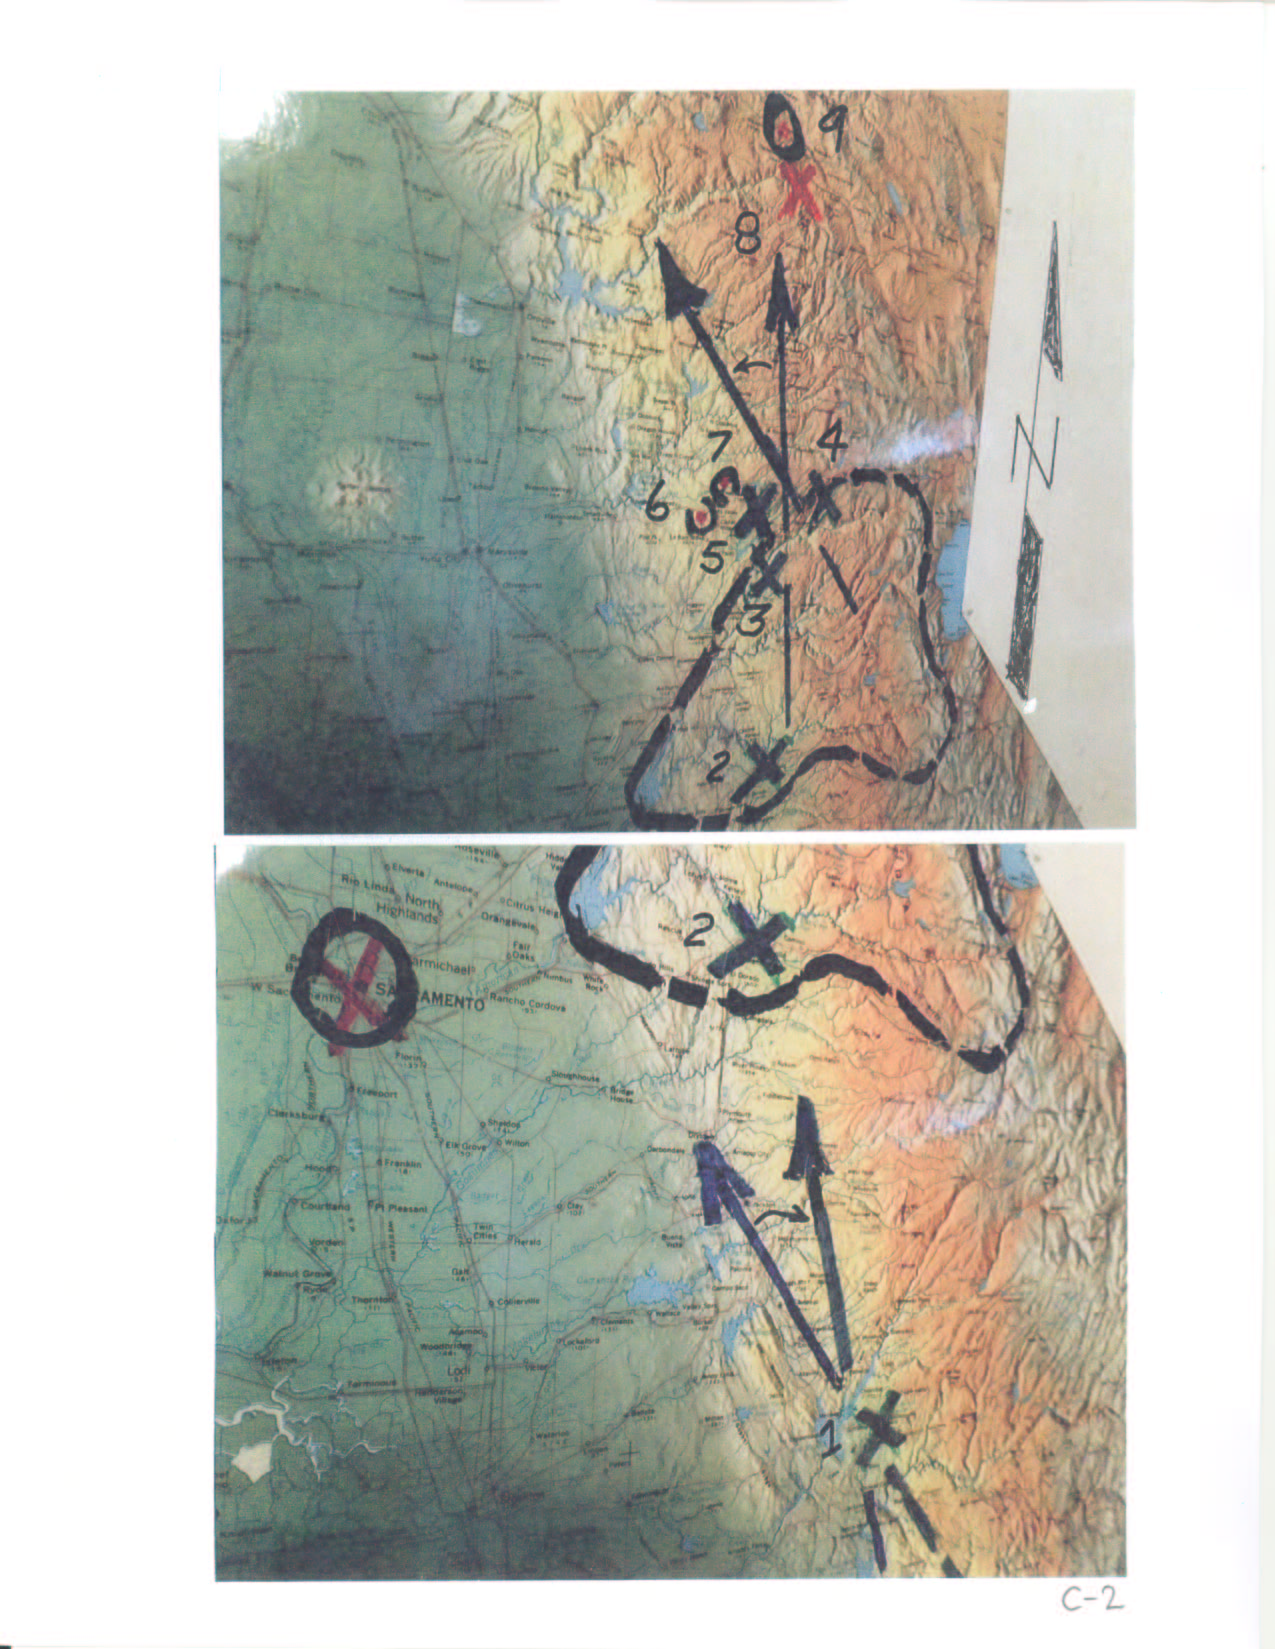
EXHIBIT "C"
There are three segments of a relief map showing the orientation of the
Sierra ridgeline as it extends from just south and east of Sonora northward
across the American River watershed as far north as Quincy. Geographical
locations of interest are identified by number. Refer to the following
locator key:
1. Sonora
2. Placerville
3. Iowa Hill
4. Blue Canyon
5. RedDog
6. Grass Valley
7. Nevada City
8. Nelson’s Point
9. Quincy
 C-1
C-1
C-2
EXHIBIT "D"
The heaviest consecutive three day rainfall amounts for 10 of the
heaviest warm storms during the period 1907 through 1964 were selected
to illustrate the effects of channeling in the Grass Valley - Nevada
City - Deer Creek -Blue Canyon - Lake Spaulding - Bowman Dam region.
Channeling occurs in this region when the strong southerly winds,
associated with heavy storm activity, interact with terrain features
that are more open toward the north. The following cross-section
illustrates this point:
Note: The three day rainfall amounts listed below, are for three
stations at different elevations located near the same latitude line.
                                   STATION
Latitude     39 deg. 13 mm. No.    39 deg. 18 mm. No.    39 deg. 19 mm. No.
Date         Grass Valley          Deer Creek            Lake Spaulding
mo./yr.      (2,400 ft.)           (3,700 ft.)           (5,150 ft.)

Mar. 1907    10.2 in.              14.0 in.              14.2 in.
Jan. 1909    13.6 in.              20.2 in.              12.8 in.
Mar. 1928    10.2 in.              14.0 in.              13.3 in.
Dec. 1929     8.0 in.              13.4 in.              10.2 in.
Dec. 1937    10.8 in.              13.4 in.              14.2 in.
Nov. 1950    11.4 in.              16.4 in.              14.6 in.
Dec. 1955    12.8 in.              18.8 in.              18.8 in.
Oct. 1962    18.0 in.              20.4 in.              18.6 in.
Jan. 1963    12.6 in.              18.8 in.              16.2 in.
Dec. 1964    14.2 in.              19.8 in.              20.0 in.

Average:     12.2 inches           16.9 inches           15.3 inches
Note: Above information taken from a graph. Accuracy of each reading
within ~ 1/10 of an inch. Blue Canyon latitude: 39 deg. 17 min. No.
[Blue Canyon] elevation: 5,280 ft.
Discussion and Conclusions:
1. The 1909 three-day total at Bowman Dam (13.59 in.) supports the
three-day total of 12.8 in. at Lake Spaulding.
2. The 1962 three-day rainfall total at Nevada City (19.04 in.) supports
the three-day total of 18.0 in. at Grass Valley.
3. The generally larger rainfall amounts at Deer Creek are due to the
stronger winds caused by channeling. It also suggests that Blue Canyon
is close enough to be included in the outer edge of this increased flow.
D-1
EXHIBIT "E"
Verifying estimated rainfall totals for superflood producing storm
of January 9, 10 and 11, 1862 at Blue Canyon. Estimates were made
along two different routes.
Route "A": Red Dog - Iowa Hill - Blue Canyon.
Route "B": Sonora -Placerville - Iowa Hill - Blue Canyon.
Route "A": Red Dog - Iowa Hill - Blue Canyon
Section I: Estimated 3-day rainfall (January 9 - 11, 1862) for Red Dog
Step No.1: Refer to Exhibit B for a copy of rainfall data.
                 Red Dog        Grass Valley
January 9  - -    no data       2.77 .in.
January 10 - -    5.82 in.      5.10 in.
January 11 - -    5.50 in.      4.33 in.
Two Day Total:   11.32 in.      9.43 in.
Step No. 2: Using ratio and proportion to estimate rainfall
amount for Red Dog on January 9th.
 9.43 in.  · ·   2.77 in.  X = 11.32 x 2.77. = 3.33 in.
l1.32 in.  · ·     X              9.43
Step No. 3: Daily rainfall (January 9 - 11, 1862) at Red Dog.
 3.33 in. January 9, 1862 estimate
 5.82 in. January 10, 1862
 5.50 in. January 11, 1862
14.65 in. Final 3-day estimate for Red Dog
Section II: Estimating 3-day (January 9 - 11, 1862) rainfall for Blue Canyon.
Step No. 1: Combining 3-day adjusted orographic lift factor
(Iowa Hill - Blue Canyon) for February 1986 storm with Red Dog’s
3-day rainfall total. See page 11 of Main report.
14.65 in. + 7.05 in. = 21.70 in.
Step No. 2: Make adjustment for the 130 foot difference in elevation
between Iowa Hill (2,930 feet) and Red Dog (2,800 feet).
1.3 x .30 in./100 feet = .39 in.
Step No. 3: Final Blue Canyon estimate along Route "A":
21.70 in. + .39 in. = 22.09 in.
E-1
Route "B": Sonora - Placerville - Iowa Hill - Blue Canyon
Section I: Estimated 3-day rainfall (January 9 - 11, 1862) for Sonora.
Step No.1: Estimate precipitation total for the first January
1862 10-day storm period at Sonora (January 2 through January 11, 1862)
using Sacramento data as a guide. Divide first 10-day storm period total
in Sacramento (6.55 in.) by the total for the second 10-day storm period
(8.23 in.). Result: 79.6%
Step No. 2: Assuming the same proportional distribution of the
precipitation in the Sonora area, multiply Dr. SneIl’s (30 in.) total for
the second 10-day period by (79.6%). The result: 23.9 in. which is
the estimated total at Sonora for the first 10-day storm period.
Step No. 3: Estimating 3-day rainfall total for Sonora
(January 9 - 11, 1862), using Sacramento precipitation distribution as
a guide. Divide the first 10 day Sacramento storm total (6.55 in.) into
the 3-day warm storm total (3.16 in.). Result: 48%.
Step No. 4: Multiply 23.9 in. by .48 = 11.47 in. This is the
estimated 3-day total at Sonora for the January 9 - 11, 1862 storm.
Section II: Estimated 3-day rainfall (January 9 - 11, 1862) for
Blue Canyon along Route "B": (Sonora - Placerville - Iowa Hill - Blue Canyon).
Step No. 1: Estimated rainfall amounts listed by segment
       11.47 in. Sonora - Placerville (assumed to be equal)
        3.6  in. Placerville - Iowa Hill (lift factor)
        7.05 in. Iowa Hill - Blue Canyon (adjusted lift factor)
Total: 22.12 in. Final Blue Canyon estimate for Route "B"
Comments and Conclusions: Considering the size of the area and
the variation of the terrain, we think the results are truly amazing!
Only 3/l00ths of an inch separates the two Blue Canyon estimates!
Even if the difference was 3/l0ths of an inch, the difference
between the two estimates would be less than 1 1/2%. Without a
doubt this proves how uniform and proportional the distribution of the
precipitation was for these two super storms--throughout the region.
This incredible consistency is strong support for our final 3-day
estimated rainfall increase of 13.3% for the January 9-11,
1862 storm at Blue Canyon. Refer to section "I" of the Main report
to review method used to derive our final estimate.
E-2
EXHIBIT "F"
Introduction: Other researchers have claimed that rain shadows
have reduced the amount of rain that fell on the American River watershed
during the January 9 - 11, 1862 flood producing storm. The following
news articles dispute this claim:
1. Sacramento Union - - January 10, 1862
a. Websters: 35 miles east of Placerville - - South Fork of American
as high as it was at any time this season; still rising.
2. Sacramento Union - - January 14, 1862
a. Placerville, January 10 at 9 PM - - Editors Union: Rain, Rain, Rain!
There seems to be no let up to it; for three days it has poured down upon
us and at this writing it seems to be coming down in torrents -- rivulets
are turned into rivers which sweeps everything before them.
b. THE FLOOD IN GEORGETOWN: A correspondent of the Union writing from
Georgetown, El Dorado County, January 10 says: the hardest rain ever
known in the mountains by any of our old settlers has been falling here
for the last three days and nights, and it has been impossible to cross
any of the small streams.
F-1
MODIFIED VERSION of NRC’s Figure 3.1
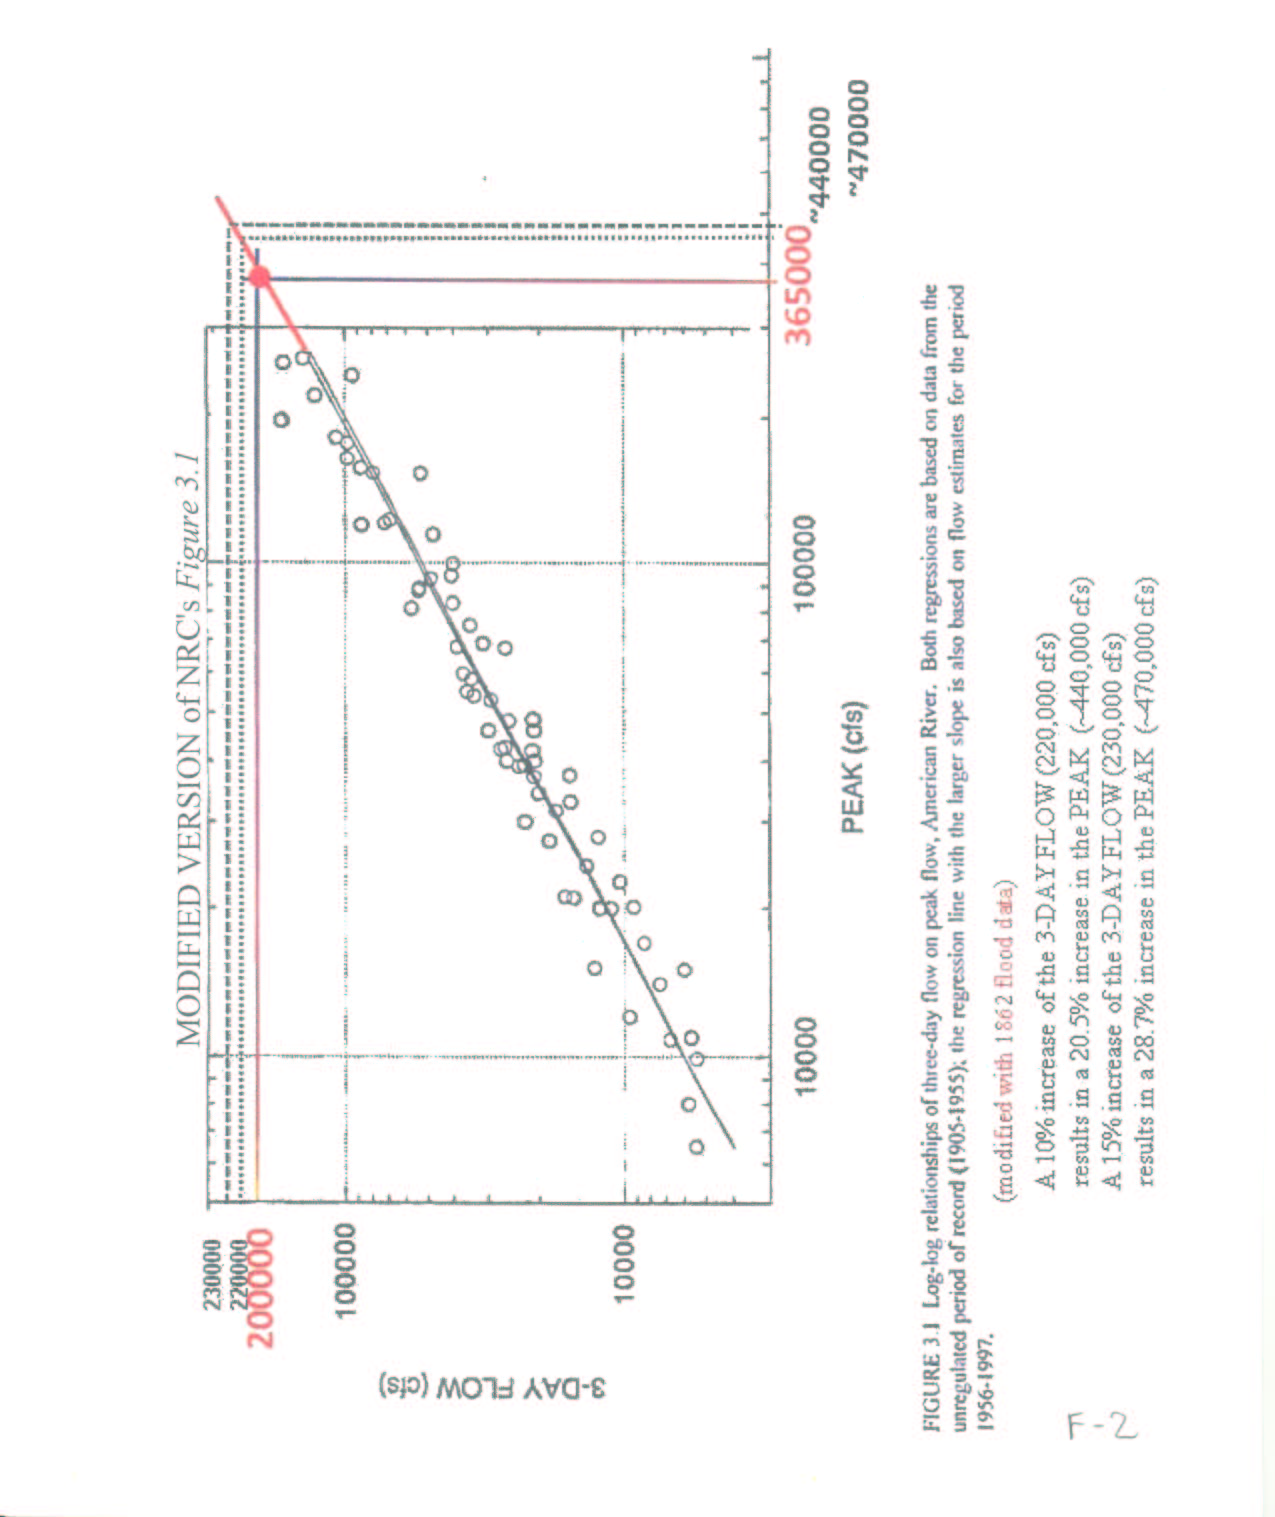
FIGURE 3.1 Log-log relationships of three-day flow on peak flow,
American River. Both regressions are based on data from the unregulated
period of record (1905-195S), the regression line with the larger slope
is also based on flow estimates for the period 1956-1977.
(modified with 1862 flood data)
A 10%-increase of the 3-DAY FLOW (220,000 cfs) results in a 20.5% increase
in the PEAK (~440,000 cfs)
A 15% increase of the 3-DAY FLOW (230,000 cfs) results in a 28.7%
increase in the PEAK (~470,000 cfs)
F-2
FIGURE 1 - HOURLY RATE of INCREASE in WATER LEVEL @ 7th & P on
JANUARY 10, 1862
F-3
FIGURE 2 - ESTIMATED JAN. 1862 JET STREAM (Storm Track) LOCATIONS
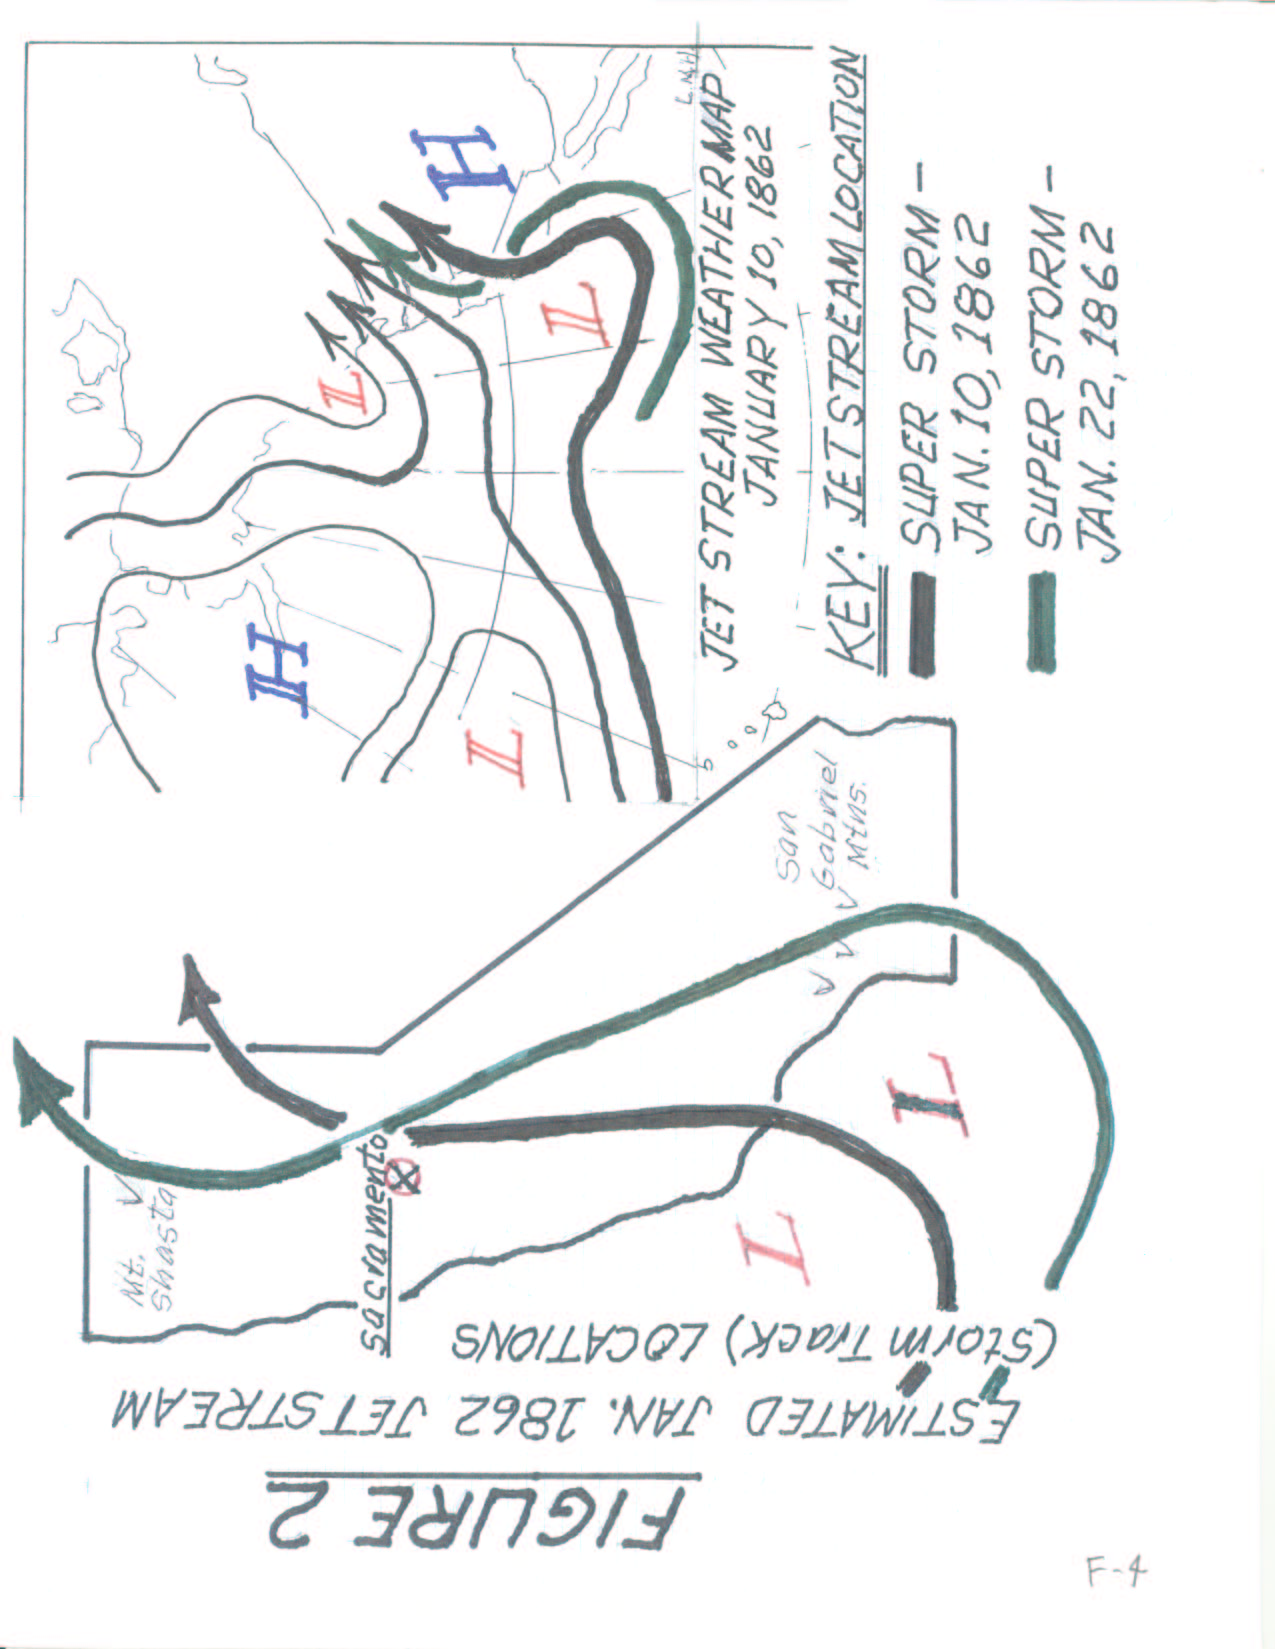
F-4
FIGURE 3
Using 20th century Grass Valley - Nevada City area rainfall data to
estimate the heaviest 3-day January 1862 rainfall at Blue Canyon.
In an effort to have a more compatible sample we selected only those
heavy 3-day warm storms that produced between 3 and 4 inches of rain
in Sacramento. We chose this range of values because both heavy 3-day
warm storms of January 1862 recorded a little over 3 inches in Sacramento.
If we extend the regression line and use the * 14.7 inch DWR
January 1862 3-day rainfall estimate for Nevada City, we get a 3-day
estimate for Blue Canyon of ~ 21 inches. The Grass Valley vs. Blue
Canyon graph also yields a 3-day Blue Canyon estimate of ~ 21 inches.
*Note: This estimate can be found in the February 23, 1999 DWR
report: Analysis of 1862 Precipitation and Runoff
Nevada City vs. Blue Canyon
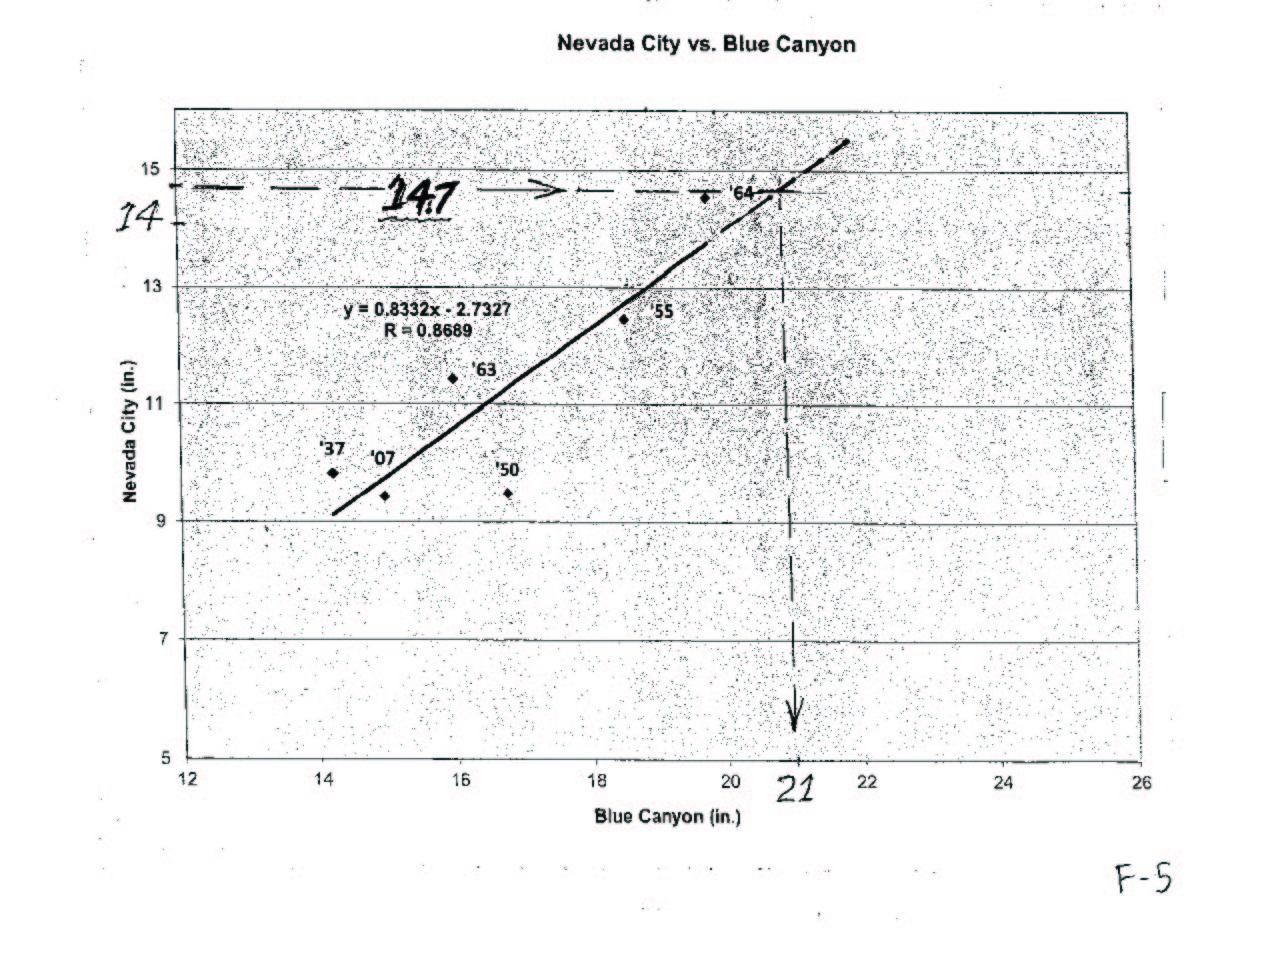
F-5
Grass Valley vs. Blue Canyon
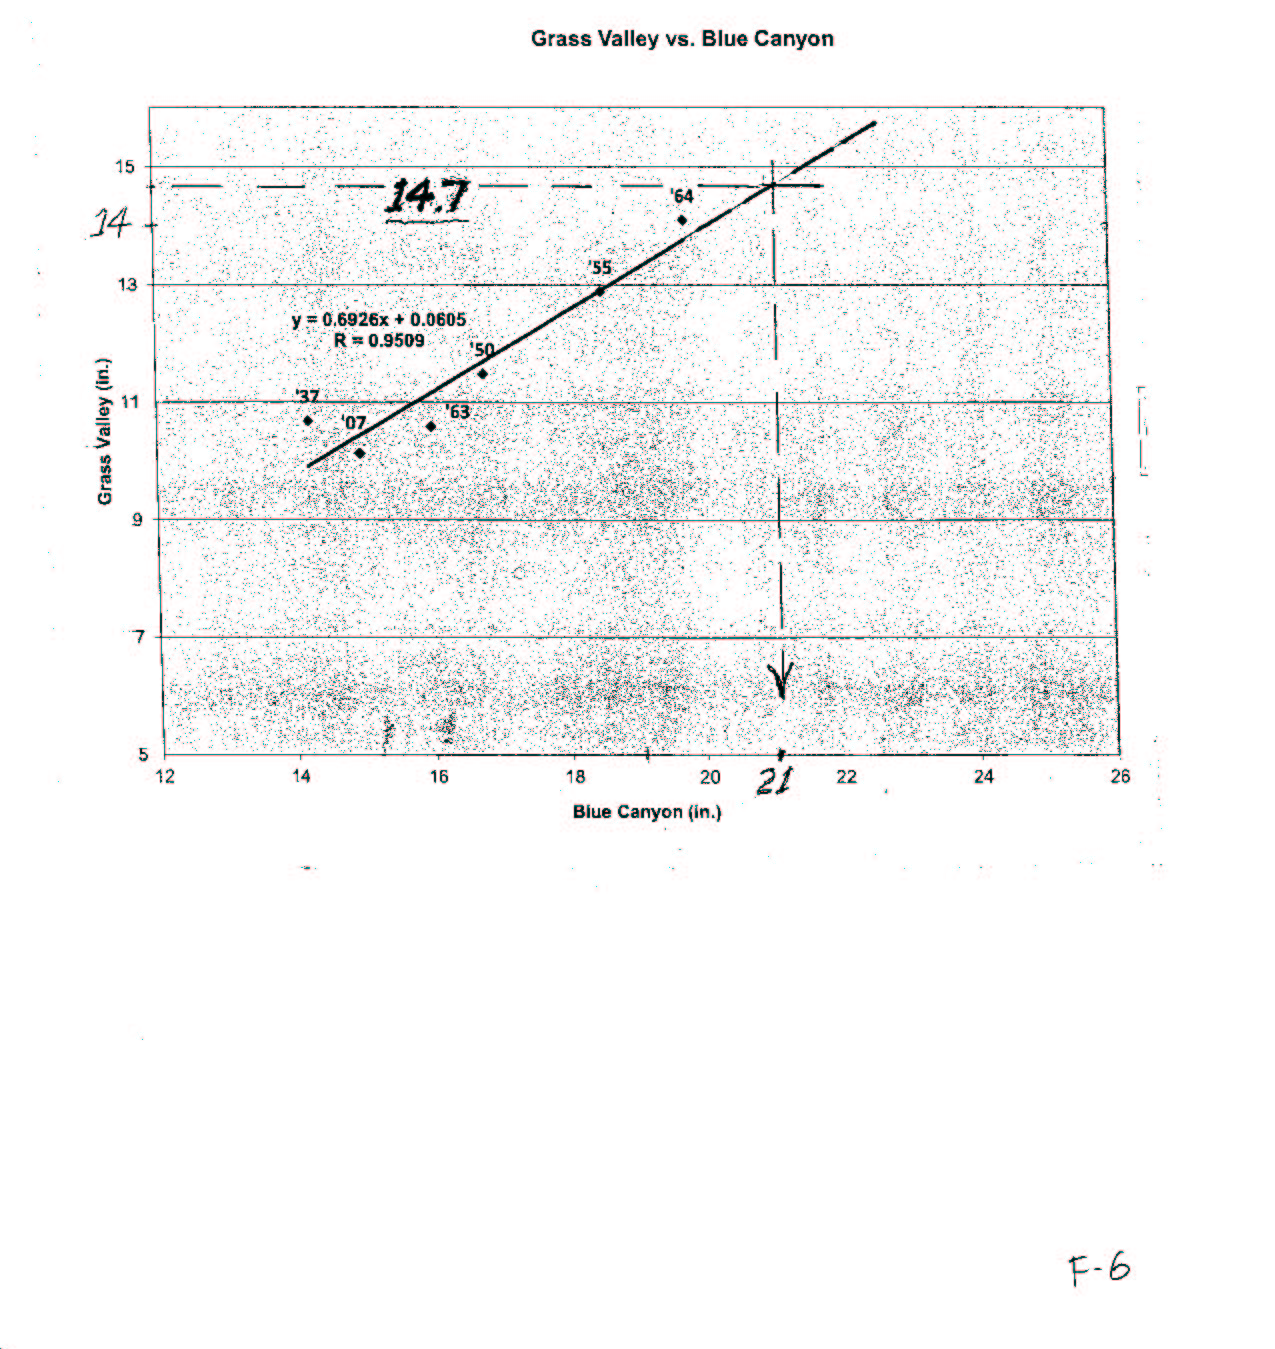
F-6
--Mike Barkley, 167 N. Sheridan Ave., Manteca, CA 95336 (H) 209/823-4817
mjbarkl@inreach.com
No more excuses! - Cure Multiple Sclerosis now!